Warranty
Labels: cartoon
posted by njr at 22:00 PERMALINK
![]()
On control groups, lift, direct marketing and analytics . . . mainly
I talked in The Fundamental Campaign Segmentation about the four possible classes of targets for marketing. Three of these have names that everyone seems reasonably happy with:
However, the last group, containing those we affect negatively by treatment, is more controversial. In a retention context, these are the people whom we actually trigger to leave. I had called them “Sleeping Dogs”, because we should “let them lie”. In a cross-selling context, where the effect is real but less pronounced, I had called them “Boomerangs”, because they come back and hit you in the face.
Ironically, rather like controversial advertising that polarizes customers, these two terms seem adored by some, and hated by others (at least within Portrait). The people who like them like the fact that they are memorable, particularly once they've been explained. The people who hate them, dislike the fact that they tend to need to be explained, which is much less true of the other segment names.
This blog's pretty young, but in case anyone is reading, I thought I'd list some other possibilities and solicit feedback and alternative suggestions. Here are some other possibilities, most of which could apply in a retention or a selling context, but some of which are specific to retention.
Needless to say, neither “Perverts” (OED, perverse a. Persistent in error; different from what is reasonable or required…) nor “Screw You”s (or worse) is considered usable, however apposite they may be!
Use the comments or mail me (see the Author link) if you have any thoughts, suggestions, alternatives or comments.
Labels: segmentation, text, uplift
posted by njr at 14:39 PERMALINK
![]()
A lot of this blog is about Uplift. You may wonder why I use an ugly, slightly redundant term like uplift when marketers normally talk simply about lift. The reason is that they are completely different.
Lift is a measure of targeting effectiveness that tells you how much better than random your targeting is. The idea is simple. Suppose you get a 1% purchase rate if you target randomly, and a 3% purchase rate if you target only segment A. Then the lift is 3% / 1% = 3. If you have a score (say, purchase probability) then you can plot lift as a function of volume targeted (starting with the best customers), and it will look something like this (assuming your score allows better-than-random targeting):
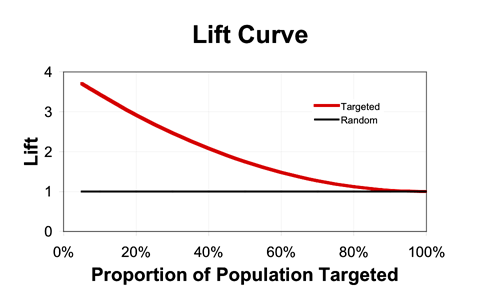
Lift curves show the same information as Gains Charts (with which they are often confused) but display it in a different way. And they always end at 1 because of course if you target the whole population, you get the same response rate as if you target randomly (on average).
In contrast, uplift directly measures the (additive) difference between the expected outcome in a treated group and control group. For a binary outcome, such as purchase, this is
P (purchase | treatment) – P (purchase | no treatment).
For a continuous outcome, such as spend, this is
E (spend | treatment) – E (spend | no treatment).
So in summary,
Labels: measurement, response, text, uplift
posted by njr at 08:21 PERMALINK
![]()
I am going to attempt to change forever the way you think about marketing campaigns, but I need your help: I need you to suspend disbelief for a few paragraphs,
Let's think about a direct marketing campaign intended to stimulate purchase of a particular product—Product X. We'll make it very clean, by assuming our goal is simply to get people to purchase Product X within one month of the campaign drop.
We get to choose whether to include each customer in the campaign, and each customer either does or does not purchase Product X. Of course, customers can buy Product X even if they're not included in the campaign. As rational marketers, our goal is to generate incremental sales, i.e. ones that would not have occurred without the campaign.
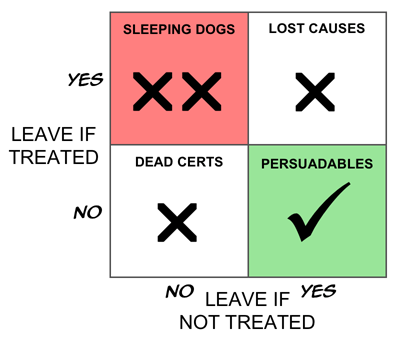
Now let's segment these customers into four groups as follows.
I'm not a great fan of Boston Boxes, but this does seem like a case screaming out for one, so here it is.

If our goal is truly to maximize the return on our marketing investment, and if we assume for now, that there are no side effects (warm fuzzy feelings generated by being given an offer, even if you don't take it up—that sort of thing), it is clear that the ideal targeting strategy would be to treat only the Persuadables. That way, if you treat 100,000 people, you get 100,000 incremental sales, which is perfect. (I know, I know, people could buy two. Or Seventeen. And they could tell their friends. And you could win the lottery three weeks running…)
If you've hung in this long, there are a couple of obvious big questions. One is whether the “Boomerangs” actually exist. The other is whether we can identify these groups, even if we accept, in principle, that they must (or might) exist. I'll tackle the first of these today; the other will be the subject of a separate, future post.
There is one case in which the existence of Boomerangs (people for whom the marketing campaign has the reverse of the desired effect) is both simple to demonstrate and easy to understand—the case of retention activity. My company, Portrait, has seen numerous cases of retention campaigns that increase the rate of customer loss in certain segments, and in some cases actually increase it overall. This is not as strange as it may seem.
The mainstream state-of-the-art approach to customer retention for contract-based products (e.g. phone contracts, insurance policies, and fixed-term loans) is first to build a model of how likely people are to fail to renew. In the communications industry, such models are called “churn models”, while in financial services they are normally known as “attrition models”. In the simplest case, people with a high modelled propensity to leave are targeted with a retention action. A more sophisticated approach weights the attrition probability with an estimate of customer value, so that retention activity focuses more on revenue (or profit) at risk than on customers per se.
It's obvious that there is a strong correlation between a customer's level of satisfaction with a service and his or her likelihood of renewing. So modelling attrition probability is pretty similar to predicting dissatisfaction, i.e. the customers most commonly targeted by the standard approach are those who are unhappy with the provider.
Many of us, however, are lazy. Even though I might hate my phone provider or insurance company, there's a good chance that I won't, make the effort to dig out a number and call them up to cancel. It's just too much hassle.
But what if that company takes the trouble to call me up just before my renewal is up? Needless to say, this removes a crucial obstacle to my cancelling, and there's a very good chance I'll say “Ah, I don't suppose just cancel right now is there?” Especially if the call itself annoys me, as is the case for many people.
We have overwhelming evidence that such triggered cancellation is a real and common phenomenon. Boomerangs definitely exist in many, if not most, retention campaigns, though I tend to think of this segment more as “Sleeping Dogs” who are best left to lie. (Though my colleague, Neil, tells me that in Liverpool the phrase is “Don't let sleeping dogs lie.” What can I say?)
But even where such Sleeping Dogs do exist, unless the retention action is spectacularly inept there will be other segments in which the retention efforts can bear fruit. The trick is to separate the wheat from the chaff—or in this case, the Persuadables from the Sleeping Dogs.
Here is the corresponding Boston Box for retention campaigns
For demand generation campaigns—cross-selling, up-selling, deep-selling etc.—negative effects are usually smaller. However, we have compelling evidence that they do exist. This matters because even a company happy to lavish attention on customers whose behaviour will not be positively affected by it should think twice before actually spending money to drive business away.
As you might expect, more intrusive contact mechanisms (particularly phone calls) swell the numbers of Boomerangs, as do campaigns that are narrower, more divisive or risqué. One of our clients claims he always sees negative effects in the last one or two deciles.
From one perspective, the Dead Certs (people who will buy whether we treat them or not) and the Lost Causes (who won't buy whatever we do) are equivalent: our action has no impact on either group. Thus if we think only in terms of our impact, a simpler segmentation is into the group we affect positively (the Persuadables), the group for whom our intervention has no effect (collectively, the Unshakables), and the group we affect negatively (the Boomerangs, or Sleeping Dogs).
If we assume that we can predict the change in purchase probability for each person, we can then plot an incremental version of a gains chart to produce the “Italian Flag” diagram, as below.
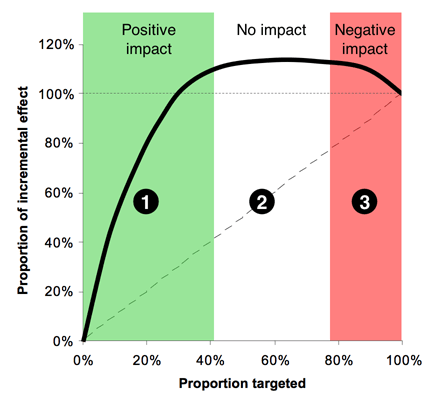
Zone 1, (the green stripe), consists of the people we can affect positively—the Persuadables. If we could identify them perfectly, this would be a straight line, that comes to an abrupt halt, but with any real model, the best we can do is identify them probabilistically, hence the curve. Obviously Zone 1 is where we spend money to make money---a reasonable proposition. Zone 2, the white stripe, is all the people who are largely unaffected by our action—a mixture of the Dead Certs and Lost Causes. Here the line would be perfectly horizontal if we could identify these groups with certainty. In Zone 2 we spend money for no appreciable return. Zone 3, red, is the group where we have a negative effect—the Boomerangs if we're selling things, and the Sleeping Dogs in a retention context. This is the disaster zone, in which spend money to drive away business. There is no rational case for targeting here.
Moving to this slightly more nuanced view, where we deal in probabilities rather than known outcomes, we can recast anyone whose probability of purchasing is increased by our action as a Persuadable; those whose purchase probability is largely unaffected as an Unshakable, and those whose probability of purchase is reduced as a Boomerang.
The trouble with conventional so-called “response” models is that, despite their name, they don't model response at all: they model purchases pure and simple: they don't look at the untreated population in the model-building process. So it's not that they simply conflate the Dead Certs with the Persuadables: they will actually also tend to recommend targeting people whose likelihood of purchase is reasonably high if treated, but even higher if left alone. Quite simply, “response” models aren't: they model the wrong thing.
In future posts, I'll discuss how we might go about segmenting people for real, and how we might model the change in response probability (the uplift) to allow us to target on that basis.
Labels: response, segmentation, text, uplift
posted by njr at 20:55 PERMALINK
![]()
If you ever want to introduce someone to the idea of targeted marketing, you could do a lot worse than pointing them to the film The Last Seduction, by John Dahl. Just look out for the late night scene where Bridget says “What I need is a list”. There are wonderful performances from Linda Fiorentino and Bill Pullman.
Dahl's Rounders is a even better film, but it has less marketing content.
Labels: targeting
posted by njr at 20:05 PERMALINK
![]()
Statistical credit scoring is almost certainly the earliest example of what we now call CRM analytics. It was largely invented in the 1950s by Fair, Isaac, still one of the leading credit reference agencies in the world.
This post is the first of a short series that will talk about the nature of credit scorecards and explain how, behind their deceptive simplicity, there is a remarkably sophisticated modelling methodology that is competitive with just about anything else in use in mainstream predictive modelling today.
But first, a story.
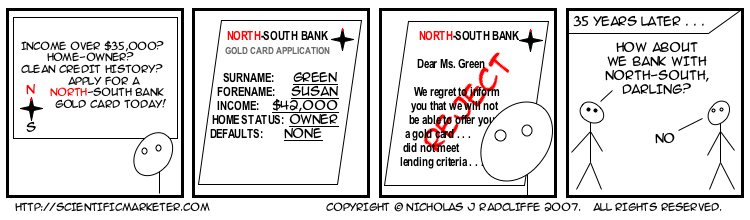
Probably ten years ago, or more, I met a woman called Mary Hopper, who had worked for Fair, Isaac for many years. She told the following story, which still stands as a salutary reminder of how difficult our messages can be to get across.
Many years previously, Mary had found herself giving a presentation to the board of a bank, in which she tried to persuade them to adopt the then new-fangled statistical approach to determining lending decisions. She had done some analysis, which showed that in segment A, to which she was recommending offering credit, only one in twenty people would default. In contrast, in segment B, where she recommended refusing credit, the rate of default would be more like one in eight. She had graphs and diagrams and tables, all of which conclusively proved (so far as statistics and models ever conclusively prove anything) that segment A was the better bet.
The members of the board listened politely, as was the custom of that halcyon era, and when she had finished, feeling rather pleased with her own performance, the bank's chairman thanked her. He assured Mary that her presentation had been extremely clear, and very convincing. He had just one minor improvement to suggest. This was that rather than lending to the whole of segment A, the bank should instead lend only to the 19 out of 20 who would, in fact, pay them back.
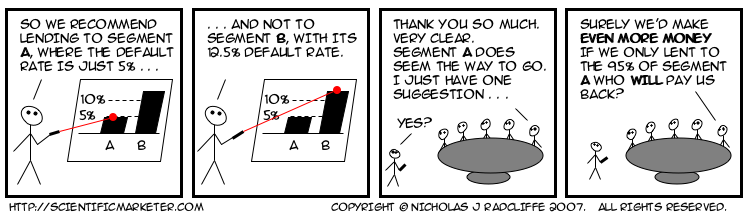
My bet is this story has repeated itself hundreds if not thousands of times since.
Stories aside, I'll finish this post with a simple description of a modern scorecard. While practices vary, most credit scores today are produced using a model with a form extremely similar to that which I will describe below.
A (consumer) credit score is a number. Conventionally, the higher the number, the better an individual's credit-worthiness. They can be scaled different ways, but perhaps the most common way is to scale them so that scores mostly lie between zero and a thousand. Each score can be mapped simply, and unambiguously, to a probability of default using a simple function.
There is a fundamental distinction between so-called application scores and so-called behaviour scores. Application scores are used when a new customer applies for a credit product with a lending organization. Because the customer is new, the lender has less information available on which to make a decision, so the main factors tend to be a mixture of questions on application forms and information that can be purchased from credit reference agencies. In contrast, behaviour scores are used to estimate the credit quality of existing customers, both for day-to-day management and monitoring purposes (including allocation of capital) and also for deciding whether to extend further lines of credit to particular individuals.
The score is formed by adding up a set of component scores. Each component can be thought of as representing some fact about the customer, and is conventionally known (in terminology popularized by Fair, Isaac) as a characteristic. Stability indicators often form a major component of scorecards, so common characteristics are things like “time in job”, and “time at this address”.
For behavioural scorecards, the emphasis tends to be much more strongly on characteristics that summarize different aspects of the individual's transactional behaviour and account management. These include things like account trends (is the balance increasing or decreasing), swings (how stable is the balance), and other key indicators such as “largest single credit transaction”.
In the most common case, the possible values for each characteristic are grouped into bands (known as attributes), and each band attracts a number of points. The customer's score is then simply formed by adding up the points for each characteristic in the scorecard.
Thus a simple scorecard might look like this.
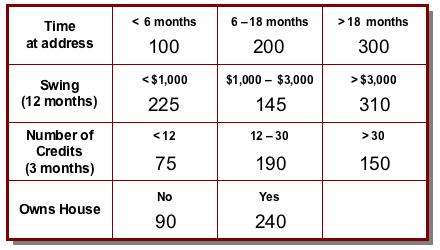
So, for example, a customer who has lived at her address for 16 months, has a 12-month swing on her account (the difference between the highest and lowest balance during that period) of $900, saw 22 credits on the account in the last 3 months and rents her house would get a score of 200 + 225 + 190 + 90 = 705.
Clearly, the scorecard is a pretty simple mechanism for coming up with a score, even if in practice there might typically be a few more characteristics, and perhaps also a few more possible values for many of them. In fact, at first glance, this might look a little too simple. Surely just adding up a bunch of component scores is a trivial way of predicting something. What about non-linearities? How could such a transparently unsophisticated system possibly compete with the subtleties of something like a neural network?
Over the next two or three posts on this thread, I'll be talking through these and other issues and showing, among other things, that beguilingly simple as it is, a state-of-the-art “numbers-in-boxes” scorecard combines extreme flexibility of modelling with a quite surprising ability to model non-linear behaviour; in fact, it is competitive with just about any other current predictive technique. Topics will include linearity (scalar multiplication and additivity) variable transformation, interactions, segmentation, binning and more.
Watch this space!
posted by njr at 22:25 PERMALINK
![]()
If you are interested in topics like customer loyalty and customer satisfaction, you might want to check out Kathy Sierra's writings at the Creating Passionate Users site. Today's on how much control is optimal for a user is excellent, yesterday's on marketing and education was great. Well, you get the pattern.
Labels: motivation, text
posted by njr at 11:28 PERMALINK
![]()
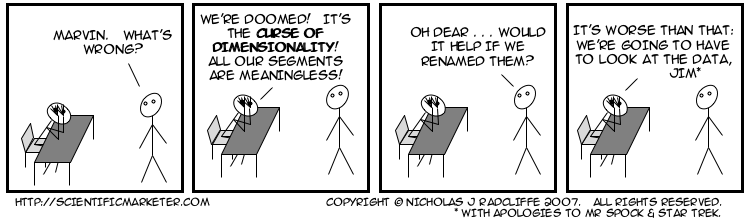
It's pretty obvious the distribution of matter in space is lumpy. Matter clumps into planets, planets orbit stars, stars clump into galaxies, galaxies group together into clusters, and―wouldn't you know it―clusters form superclusters. Thank gravity for that. There are clumps of matter, and other things, at smaller scales too. Atoms are mostly empty space, with a lot of stuff at the centre (the nucleus), and electrons like to hang around at particular distances away from the nucleus (the shells), though it's hard to pin them down. Similarly, people clump together on the Earth. London, Tokyo and Sao Paulo are pretty crowded; the Sahara, the Highlands of Scotland and central Australia mostly aren't. (People are quite hard to pin down, too.)
Cluster analysis is a set of techniques for taking the coordinates of a lot of objects (stars, particles, people…) and figuring out something about where the lumps are. There are lots of ways to do it.
Someone, deep in the mists of time, had the bright idea of applying cluster analysis to customers to figure out “where the clumps are”. The idea wasn't to use geographical coordinates (of their houses, say), but to replace coordinates with customer characteristics, like demographics (age, income etc.), behavioural measurements (spend levels, frequencies, balances etc.), and maybe attitudinal things like psychographics. That way, they thought, they might uncover the “natural groupings” of customers, which could be useful for understanding their dynamics and for segmenting them.
While it was far from a stupid idea, it turns out that it was an extremely bad idea, one that at best has wasted countless thousands of hours of analyst time, and at worst has led to baseless conclusions and highly suboptimal marketing.
There are far too many problems to do justice to in a single blog post, so I won't. Instead, I'll list some headlines here, and over the coming weeks I'll do an entry on each one. Then maybe I'll gather them into an absurdly long whole.
Here are some of the headline reasons that clustering customer characteristics isn't useful.
For avoidance of doubt (as lawyers say), and notwithstanding the impression the title of this entry may give, the problem isn't cluster analysis per se, which is a perfectly fine collection of techniques. If you want to find the clumps in a low-dimensional space with commensurate dimensions, it's exactly what you need. It's just that that isn't a very good description of a customer base.
Here are the parts posted so far:
Labels: clustering, modelling, text
posted by njr at 17:02 PERMALINK
![]()
It was Herb Edelstein who, as far as I know, first argued that IVR systems ("Interactive Voice Response") should more properly be known as Customer Alienation Systems.
He's not wrong.
Labels: alienation, text
posted by njr at 21:24 PERMALINK
![]()
Labels: cartoon, negative effects, uplift
posted by njr at 20:08 PERMALINK
![]()
Former US Secretary of Defense Robert McNamara reportedly said:
"We have to find a way of making the important measurable, instead of making the measurable important."
I heard this one morning on Radio 4's "Thought for the Day", and have never tracked down a reliable source, but I have probably quoted this more than almost anything else. I think it is a remarkable, and important, observation.
As marketers, we must strive to model that which is important, rather than making important that which we can conveniently model.
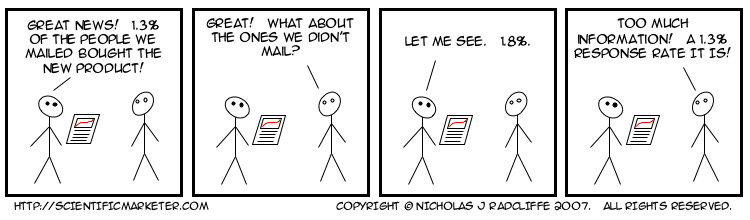
Traditional so-called "response" models do not model response all. They most commonly model the (conditional) probability of purchase, given treatment:
P (purchase | treatment)
But this isn't what affects the return on (marketing) spend. That is affected by the change in purchase probability resulting form a treatment:
P (purchase | treatment) - P (purchase | no treatment).
That is what we model if we want to target so as to maximize expected ROI.
Such models go by various names. Portrait Software (for whom I work), calls them uplift models, and used to call them differential response models. Others call them various incremental impact models, net response models, true response models, true lift models, and various other combinations of these, and other words. But they are all the same.
Uplift models predict that which is important. Traditional "response" models make important that which is easy to model.
Footnote: If you haven't seen Errol Morris's biography of McNamara, The Fog of War: Eleven Lessons of Robert S. McNamara, consider doing so. It's extraordinary. Frightening, compelling, and revealing.
Labels: measurement, quotation, uplift
posted by njr at 22:37 PERMALINK
![]()
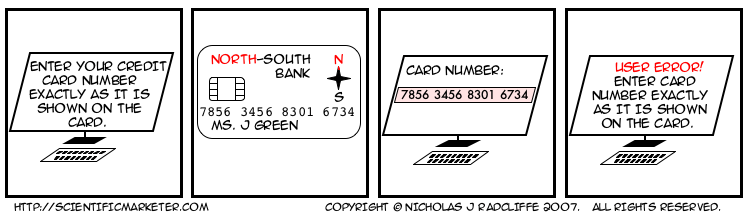
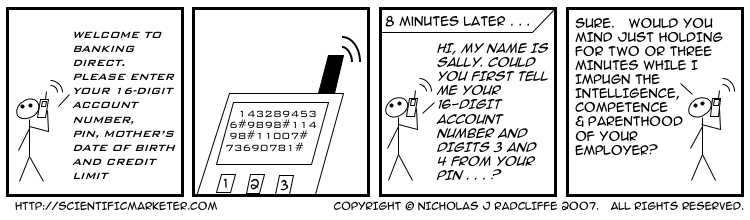
People are bad at remembering numbers, even for short periods of time. Mostly. The most that most people seem to able to remember reliably, even for a few seconds, is four digits. I thought everyone knew this. That's why we break up telephone numbers into blocks of two, three or four digits usually. And that's why the numbers on credit cards are broken up into groups of 4.
Let's suppose you have a customer who has decided he wants to pay you some money. In fact, let's suppose it's me. You present me with a form containing a box in which to enter my 16-digit credit card number. Remember, I want to pay you money.
Clearly the box should let me type in my credit card number, as it appears on the card, with spaces, in groups of four. Of course, it should also let me type it without spaces. In fact, it should completely ignore all whitespace (and probably dashes too), and provided I enter exactly 16 digits, and nothing else except whitespace, it should go and process the number. And if I typed something else, it should highlight the problem, minimally pointing out the field I got wrong on the form, and preferably telling me something helpful like "the credit card number you entered only had 14 digits". Or whatever.
Here are some of the ways you can lose my business with a very high probability.
I'm not the first person to notice this. See, among others, Jacob Nielson (9. Overly Restrictive Form Entry", The "No Dashes Or Spaces" Hall of Shame, Don't be a Sucky Webmaster, and Simson Garfinkel.
Occasionally, I complain to a company about this (usually on when my desire to give it money is overwhelming), and it staggers me how often I am told that it is too difficult to implement technically. Here is how hard it is to strip spaces in my language of the moment (python). If the number is stored in a variable called cardNumber, you have to say
cardNumber = cardNumber.replace (' ', '')
(Removing tabs and dashes or anything else is equally simple.) I admit it might take as many as half a dozen lines in some other languages, but not many. If your systems people tell you it can't be done, you need new systems people.
Remember, all I want to do is give you my money.
posted by njr at 22:42 PERMALINK
![]()
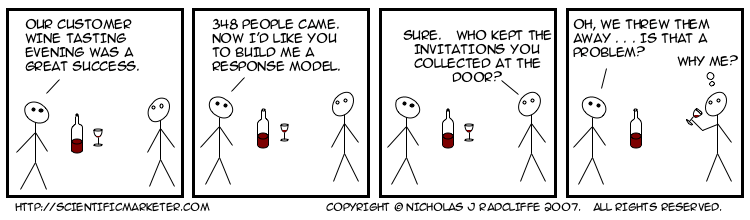
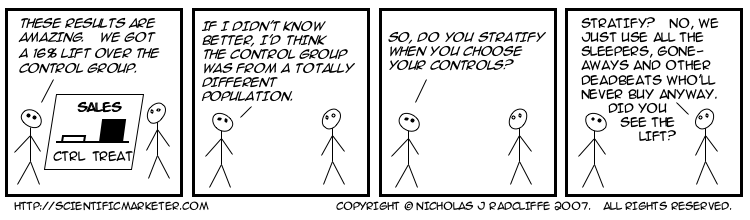
Everyone knows about control groups. They're the people who meet our targeting criteria, but whom we don't treat so that we can understand the incremental impact of our actions. I call these treatment controls, because they allow us to assess the effectiveness of our treatments.
Less commonly, a second kind of control group is used as well, a group call targeting controls. These are people who do not meet our criteria, but whom we treat anyway to check the effectiveness of our targeting.
The truly scientific marketer needs both.
posted by njr at 21:48 PERMALINK
![]()
This blog is written by Nicholas J. Radcliffe.
My day job is to run Stochastic Solutions, a company specializing in helping companies with customer targeting, including analytics, and mathematical optimization problems. As it says in the disclaimer on the front page, the opinions in this blog are my own, and are not necessarily shared by anyone else.
This blog is really about customer management and how models and measurement can help companies to treat customers more appropriately. Some of this is about trying to do the right thing for the customer, at least when that's an economically reasonable thing to do, and some of it is just about trying to ensure that the money spent on marketing (and other forms of customer management) actually achieves something like its goal.
This blog really grew out of the extraordinary experience of developing and trying to market a radically different approach to customer modelling, something I call "Uplift Modelling" (PDF). While we found some very sophisticated companies who were already attempting to take this approach, we found it remarkably difficult to communicate some of the core ideas that underpin it. The cartoons started trying to make very simple points about marketing, mostly illustrated with embellishments of hundreds of situations we've encountered over the years. Now, however, they're taking on a life of their own, and seem to be evolving into a more general commentary on good and not-so-good practices in customer management, in general, and so-called "customer relationship management" in particular.
My background is a mixture of maths and physics, with quite a lot of computing thrown in. As well as targeting marketing, the subject of this blog, I also have a long history of research and publications in the area of stochastic optimization, and more particularly genetic algorithms, a branch of evolutionary computation. I was one of four founders of Quadstone Limited, an Edinburgh-based software house, in 1995. Quadstone was acquired by Portrait in late 2005, and served as Quadstone's CTO until August 2007. Since we set up Quadstone, I've also been a Visiting professor in the Department of Mathematics and Statistics at Edinburgh University.
I am also an advisor to a venture capitalist, Scottish Equity Partners, which invests mainly in information technology, healthcare & life sciences and energy related technology businesses.
Needless to say, my opinions are not necessarily shared by either Edinburgh University or SEP either!
I can be emailed at Stochatic Solutions as Forename.Lastname@stochasticsolutions.com (replacing Forename with my forename (Nicholas) and Lastname with my surname (Radcliffe)).
posted by njr at 13:18 PERMALINK
![]()